(€/000) | 31/12/2024 | 31/12/2023 | 31/12/2022 | 31/12/2022 | 31/12/2020 | 31/12/2019 |
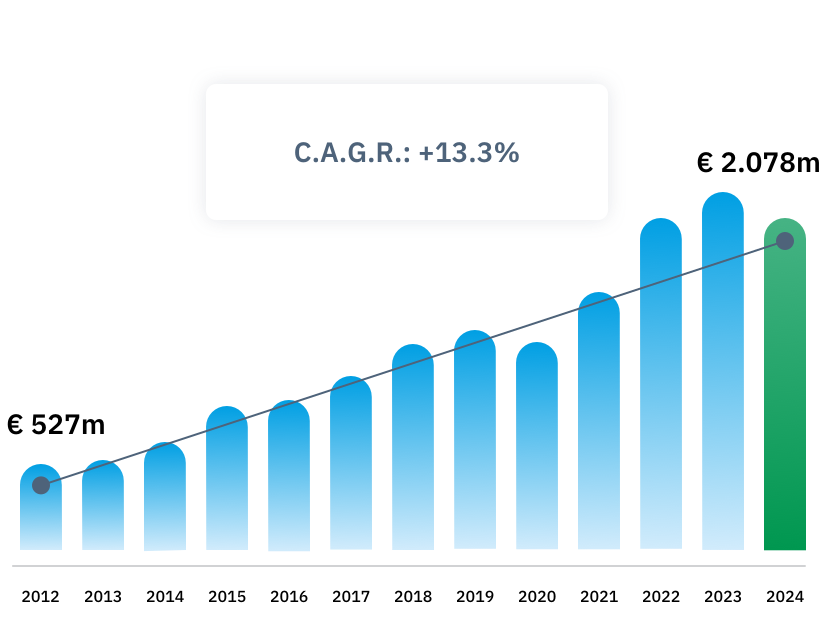
Group Net Revenues | 2,078,399 | 2,240,039 | 2,077,964 | 1,604,255 | 1,294,363 | 1,368,618 |
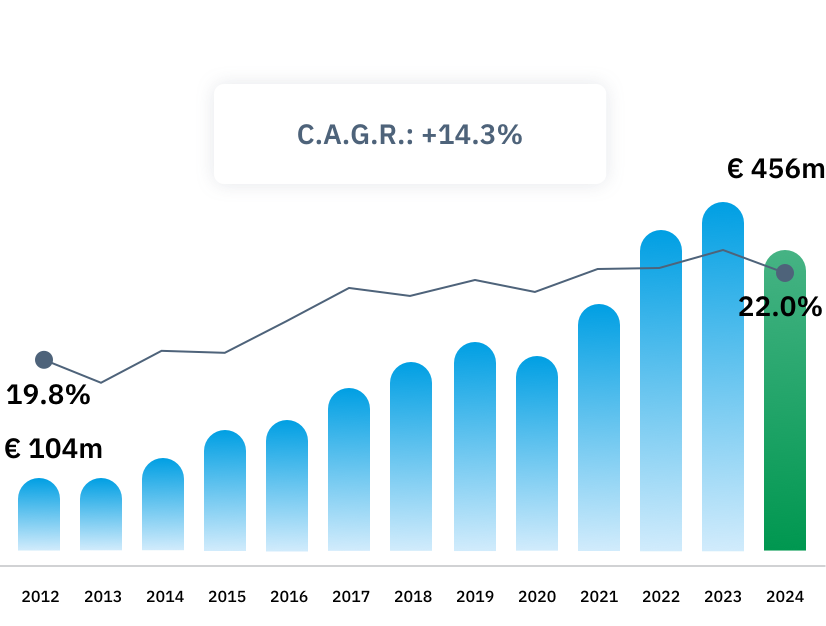
EBITDA 1 | 456,622 | 536,725 | 492,337 | 379,757 | 294,055 | 317,890 |
EBITDA margin | 22% | 24% | 23.7% | 23.7% | 22.7% | 23.2% |
EBIT 2 | 337,814 | 428,819 | 384,004 | 295,048 | 207,659 | 247,214 |
EBIT margin | 16.3% | 19.1% | 18.5% | 18.4% | 16.0% | 18.1% |
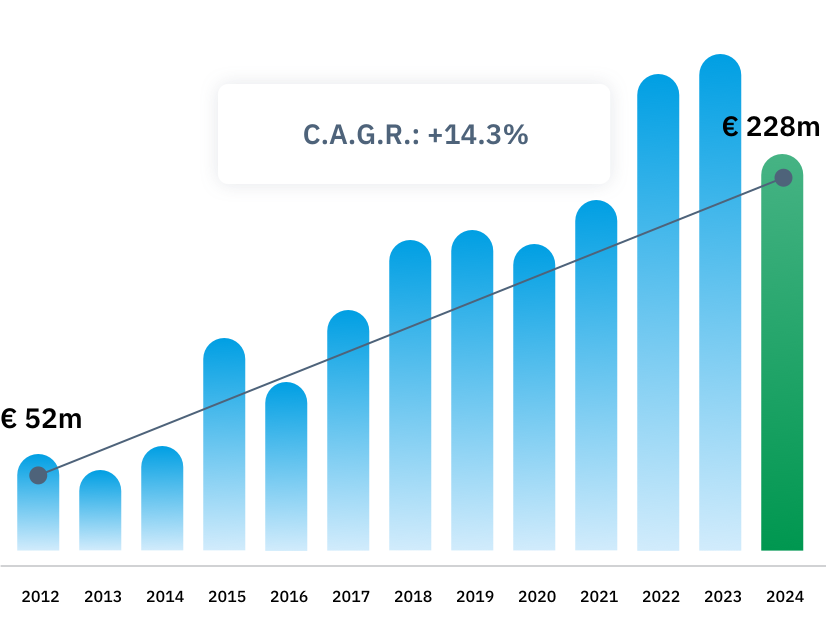
Consolidated Net Profit | 228,470 | 277,516 | 269,749 | 198,519 | 173,271 | 180,602 |
Free Cash Flow 3 | 205,088 | 147,892 | 51,100 | 133,800 | 203,769 | 124,824 |
Net Financial Indebtness 4 | 476,115 | 567,661 | 604,596 | 572,718 | 332,186 | 425,100 |
CAPEX 5 | 135,250 | 164,948 | 129,479 | 106,726 | 61,395 | 73,654 |
EPS - € | 2,124 | 2,565 | 2,524 | 1,836 | 1,596 | 1,699 |
Dividend per share 6 | 0.330 | 0.320 | 0.30 | 0.28 | 0.26 | 0.25 |
The above figures are prepared under International Financial Reporting Standard (IFRS)
1 - Earnings/(losses) before interest, tax, depreciation and amortization
2 - Earnings/(losses) before interest and tax
3 - Cash flow of operating activities less cash flow for investments in tangible and intangible fixed assets
4 - Loans obtained and Bank borrowing less Cash and cash equivalents plus debts for the acquisition of equity investments
5 - Investment in property, plant and equipment and intangible assets, net of divestments
6 - Dividends refer to the year when the distributed profits were formed